New study looks at the stats behind the online ESG report
How are sustainability reports used? Which chapters are actually read? How many stakeholders do they reach?
If you’re still only printing your ESG report, it’s hard to paint a reliable picture that answers these questions, says reporting firm nexxar. ‘If, for example, 3,000 copies are printed, nobody knows how or if they are actually read,’ points out the Vienna, Austria-headquartered company. ‘The number of copies distributed is quite simply not a reliable indicator of the reports’ range and use.’
The rise of online reports, however, means using web analytics tools, such as Google Analytics – or Piwik, in this case – now makes it possible to look at how reports are being used. For companies choosing an HTML online report over, for example, an online PDF, even users’ searches can be analyzed to give insight into what interests them most.
In this way, nexxar has analyzed the statistics of 10 sustainability reports from summer 2017 – with five coming from companies in the FT Global 500 that are, ‘as far as market capitalization is concerned, among the 500 largest companies in the world’.
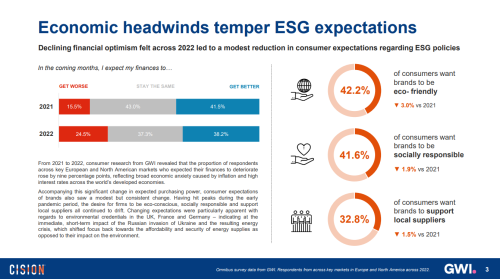
So which areas of the online sustainability report prove most popular? Company information, the corporate responsibility strategy and compliance come out on top, accounting for around a third of all page views on average. ‘This overriding information, which includes, for example, the materiality analysis, the sustainability approach and the CEO foreword, is obviously of particular interest for stakeholders,’ notes nexxar. Following these sections is an image or magazine section at 14 percent and classic report chapters on products, production and suppliers at 13.5 percent.
And while use of some company publications such as press releases might peak early on before being very rarely accessed, nexxar says this isn’t the case for sustainability reports. ‘They are of interest to stakeholders not only shortly after publication, but also have a ‘latent relevance,’ notes the firm, while Daniel Gallar, relationship manager at nexxar, adds that: 'Our statistics show a continuous, interest-specific use throughout the course of the year.'
While most companies do now publish sustainability reports online, with many companies publishing only a small amount of printed copies, Gallar warns that some trends appear misaligned with user statistics. ‘Some companies publish only a one-page digital summary version of their sustainability report, which focuses on the image-based parts,’ he says. ‘Our research clearly questions this trend [because] users' interests point to the classic cornerstones of sustainability reporting, namely the hard facts and figures.’
Most used sections of the average online sustainability report
Source: nexxar. Click for a larger image
|
Sustainability reports by the numbers |

Garnet Roach
An award-winning journalist, Garnet Roach joined IR Magazine in October 2012, working on both the editorial and research sides of the publication. Prior to entering the world of investor relations, her freelance career covered a broad range of...